Overview
“Rindow Math Plot” is a visualization library for mathematical data.
It is made to resemble python matplotlib to save time for many people to learn.
It has the following features.
- Visualize data as it is on bar graphs and line graphs
- The graph types are line, bar, horizontal bar, dot, circle, color bar etc.
- Adjust the scale automatically.
- Automatic adjustment of X and Y axis scales
- Make multiple graphs into one image
Requirements
- PHP 7.2, 7.3, 7.4, 8.0, 8.1, 8.2., 8.3, 8.4
- GD2 extension
Installation
Install the Rindow Math Plot
Please set up with composer.
$ composer require rindow/rindow-math-plot
Add extension configuration to php.ini
extension=gd2
or
extension=gd
In the case of Linux, explicitly set the viewer that displays png in the environment variable.
RINDOW_MATH_PLOT_VIEWER=/some/tool/pngviewer
export RINDOW_MATH_PLOT_VIEWER
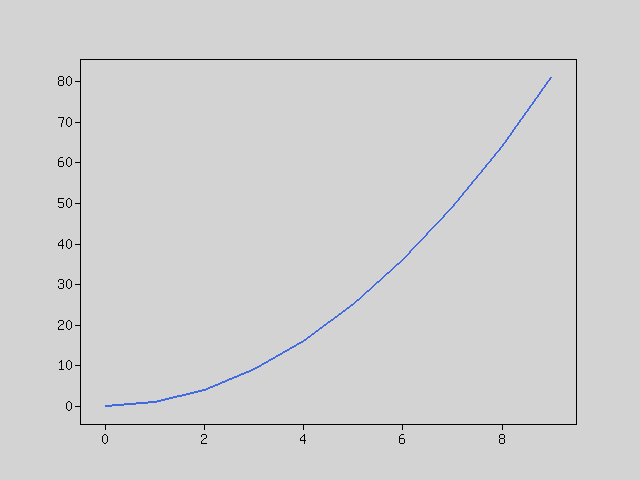
Quickstart
Displays a simple graph.
$mo = new Rindow\Math\Matrix\MatrixOperator();
$plt = new Rindow\Math\Plot\Plot(null,$mo);
$x = $mo->op($mo->arange(10),'**',2);
$plt->plot($x);
$plt->show();